
Getting Student Perspectives on Schooling
How confident do students—and teachers—feel about their learning?
Topics: School Culture and Climate, Student Engagement
Rarely do we have an opportunity to understand how the nation’s students feel regarding their educational experiences and how their sentiments shift, especially during overwhelming and unexpected changes to their environments, communities, and personal lives. The COVID-19 pandemic brought about rapid change, and understanding and responding to its effects—particularly on students—will require extensive investigation and resources.
The National Center for Education Statistics (NCES) provides critical information on the topic using data from the National Assessment of Educational Progress (NAEP)—better known as The Nation’s Report Card.
Academically, the 2022 NAEP results revealed historic declines in student performance in mathematics and continued declines in reading compared to 2019, before the pandemic began. Mathematics scores were lower in nearly every state in grades 4 and 8, and only two public school systems showed improvement in eighth-grade reading during the pandemic—the Department of Defense school system and Los Angeles.
Declines in achievement were widespread geographically and across socioeconomic levels, racial and ethnic groups, and urban and rural settings. While NAEP isn’t designed to explain why changes in academic performance occur, its results offer evidence of the complex challenges students, educators, and families endured during the pandemic.
Contextualizing Achievement
To shed light on the factors associated with academic outcomes, NCES asks students, teachers, and administrators to provide additional information about their learning experiences, dispositions, and more. Students who participate in NAEP assessments answer survey questions to help contextualize achievement results, while teachers and administrators from participating students’ schools also complete questionnaires.
Practitioners and researchers usually use achievement data to monitor whether students have mastered the required skills, but this data offers another way to gauge student abilities: simply by asking students whether they feel confident about their learning. The survey results align closely with achievement and offer another factor for consideration. As communities and schools move past the pandemic, we encourage administrators to routinely assess students’ dispositions toward learning, even on an informal basis.
NCES reports results for individual survey questions and combines questions that pertain to a single topic to form indices, rating constructs such as student confidence in their knowledge and skills or their enjoyment of a particular subject. While qualitative data often shows relationships with NAEP’s achievement results, NAEP questionnaire data is not causal and does not interpret any contextual factor as the sole reason for achievement results.
That said, questionnaire data can contribute to our understanding of the educational landscape by capturing changes in the student experience, especially during the pandemic. In recent years, for example, NCES asked students about their confidence in completing various academic tasks. In 2019 and 2022, fourth graders were asked to what degree they felt they could do the following:
- Estimate the weight of five apples using pounds.
- Divide 42 stickers among six students.
- Find the amount of carpeting needed to cover a rectangular floor of a defined length and width.
- Know when to take a turkey out of the oven if it goes in at 10 a.m. and takes 3 hours and 45 minutes to cook.
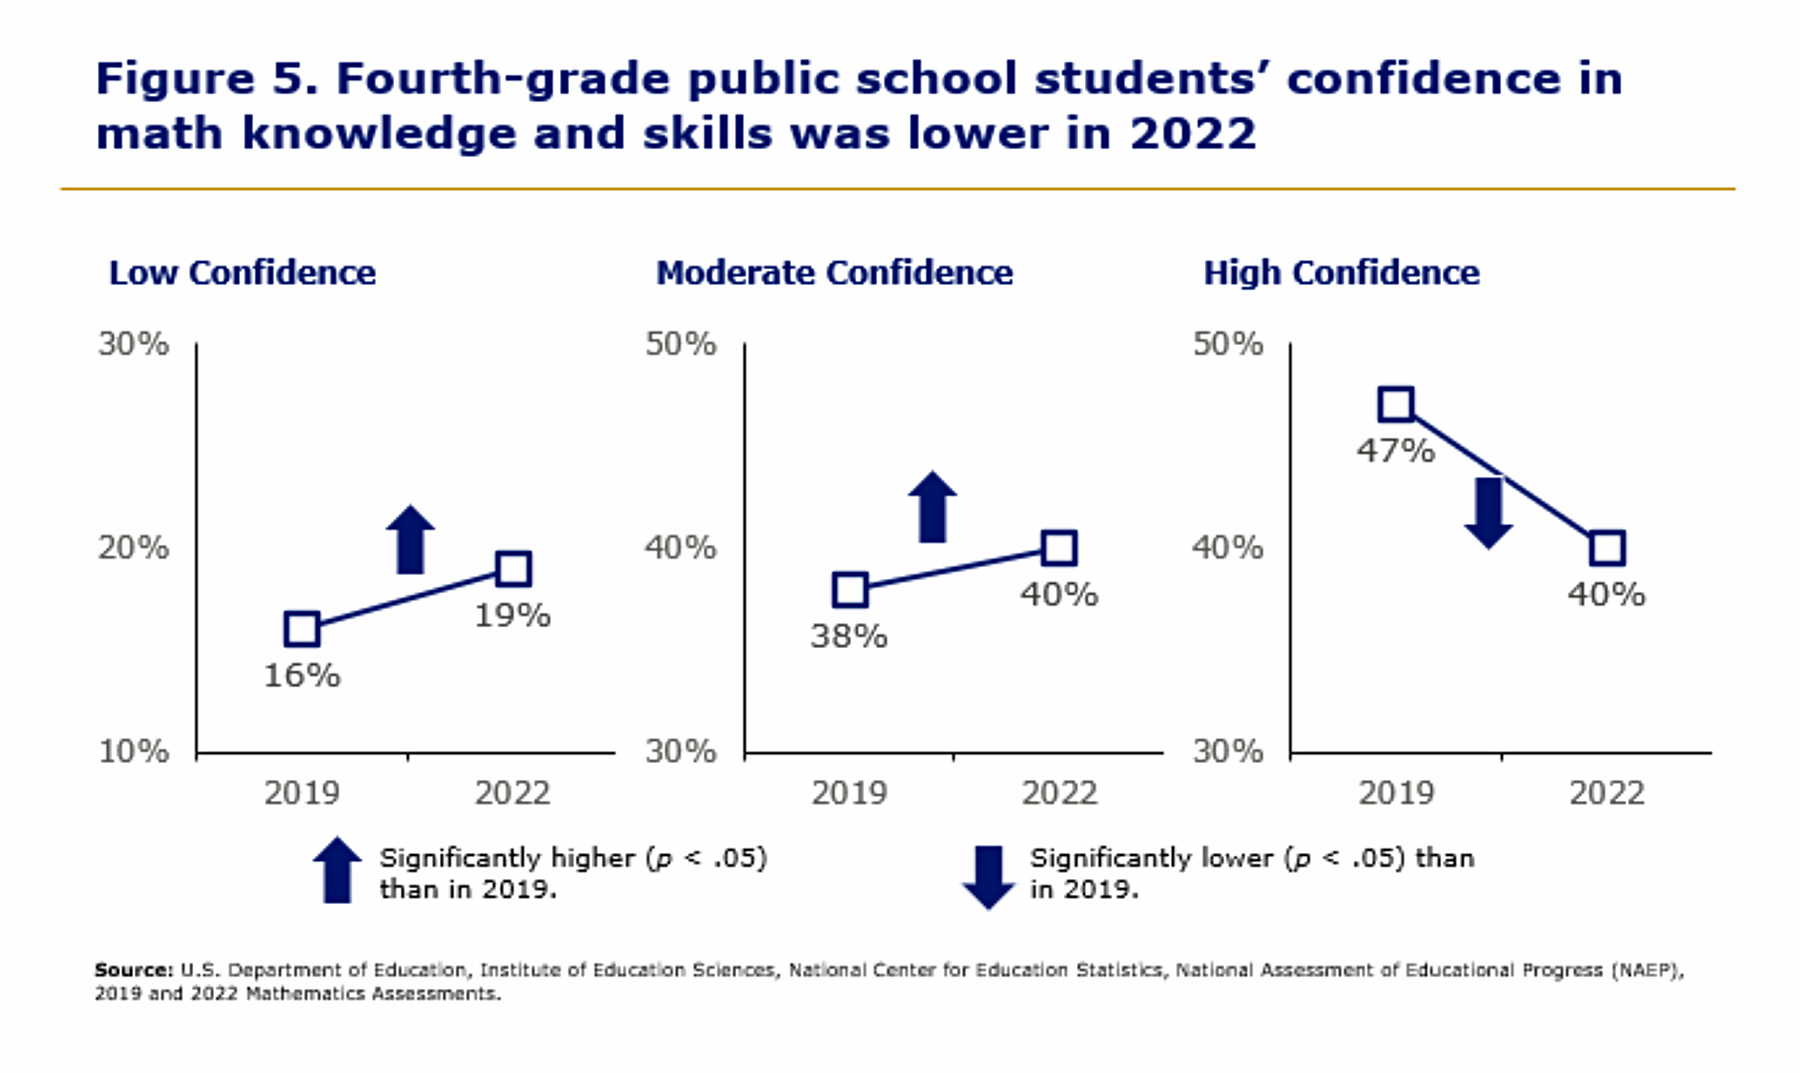
NCES reported the results for each question individually and as an index for student confidence, categorizing the students into having low, moderate, and high levels of confidence. As Fig. 5 shows, the proportion of students with high confidence dropped from 47 percent in pre-pandemic 2019 to 40 percent in 2022, while the proportions of students in the low and moderate confidence categories grew. Similar patterns were evident in grade 8 mathematics and in grades 4 and 8 reading.
“In my assessment of the post-pandemic educational landscape, we have observed a decline in scholars’ confidence in their academic capabilities,” says Kourtney Miller, a member of NAEP’s Principals’ Panel and former head of schools at the Cesar Chavez Public Charter School for Public Policy in Washington, D.C. “This decrease can be attributed to a range of factors that emerged during the pandemic, and they continue to affect students’ confidence levels post-pandemic.”
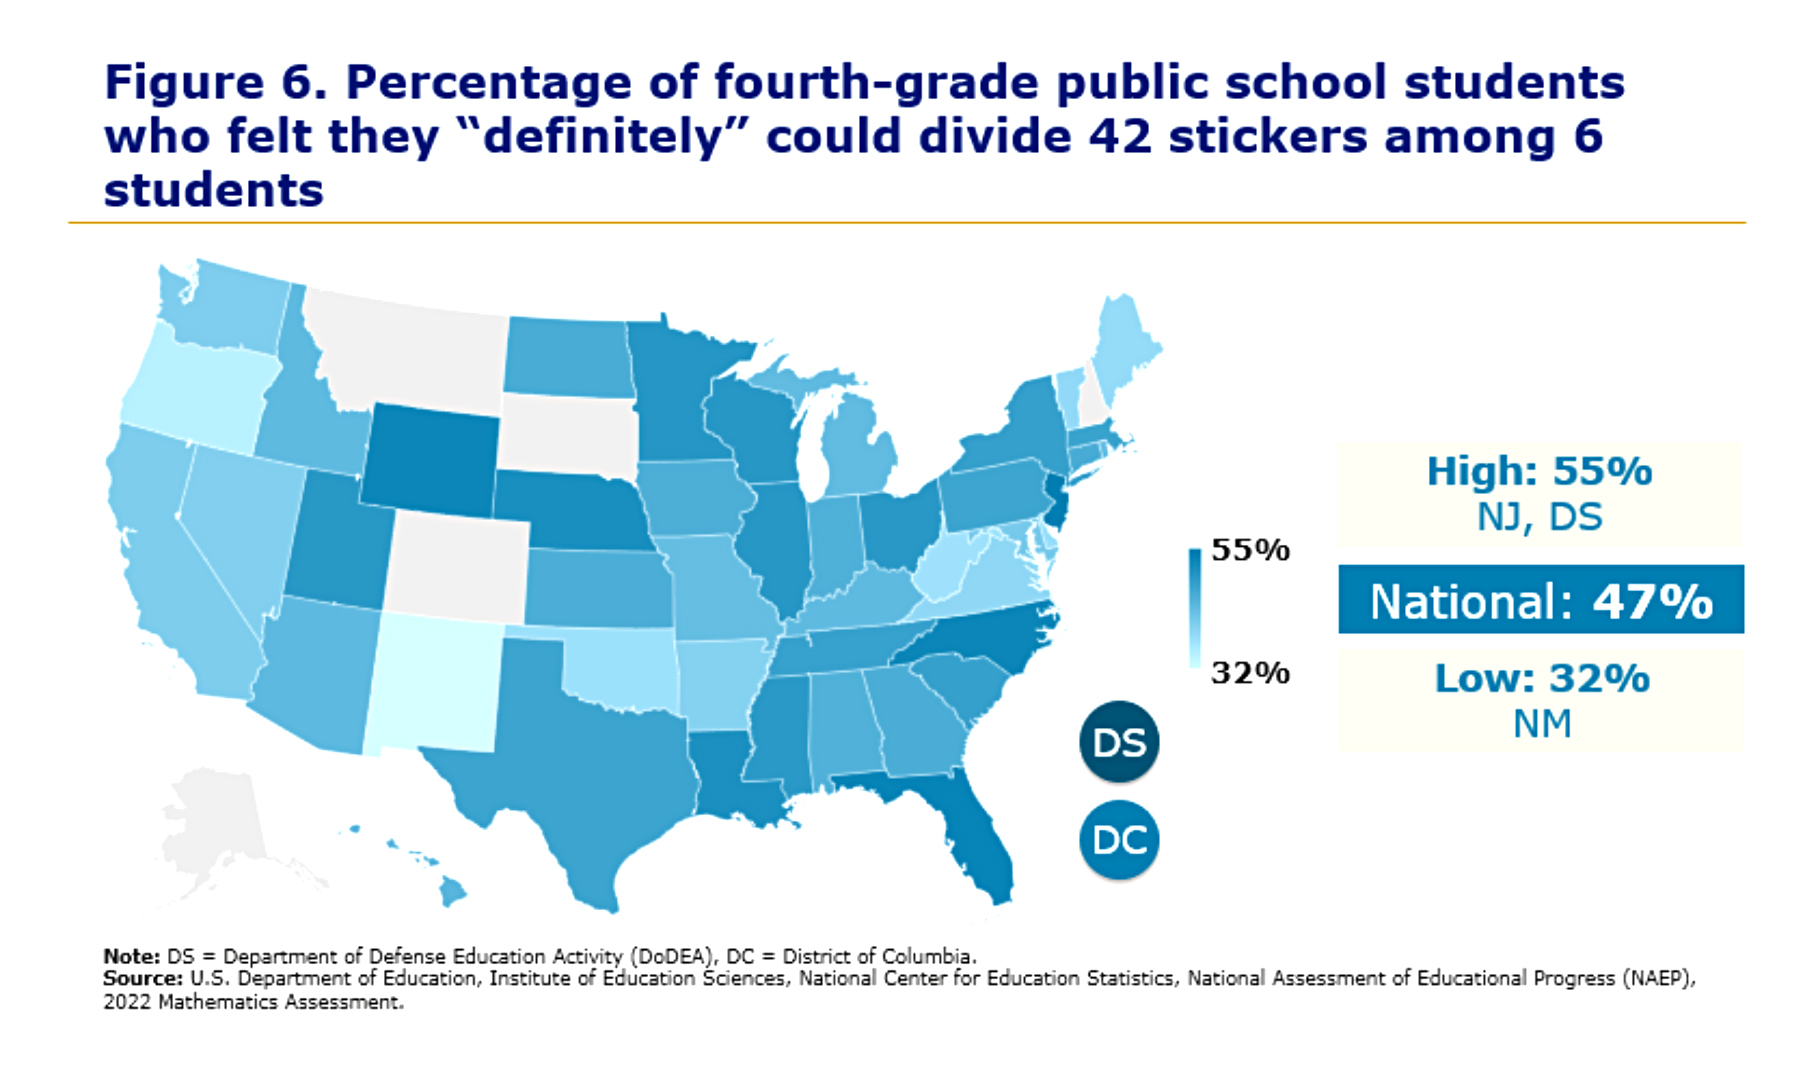
The percentage of students who reported having high confidence in their mathematics skills at grade 4 varied across the country. Looking specifically at the question about fourth graders’ confidence in being able to divide 42 stickers among six students, the percentages of public school students who said they “definitely” could complete the task ranged from 32 percent in New Mexico to 55 percent in New Jersey and Department of Defense schools (Fig. 6).
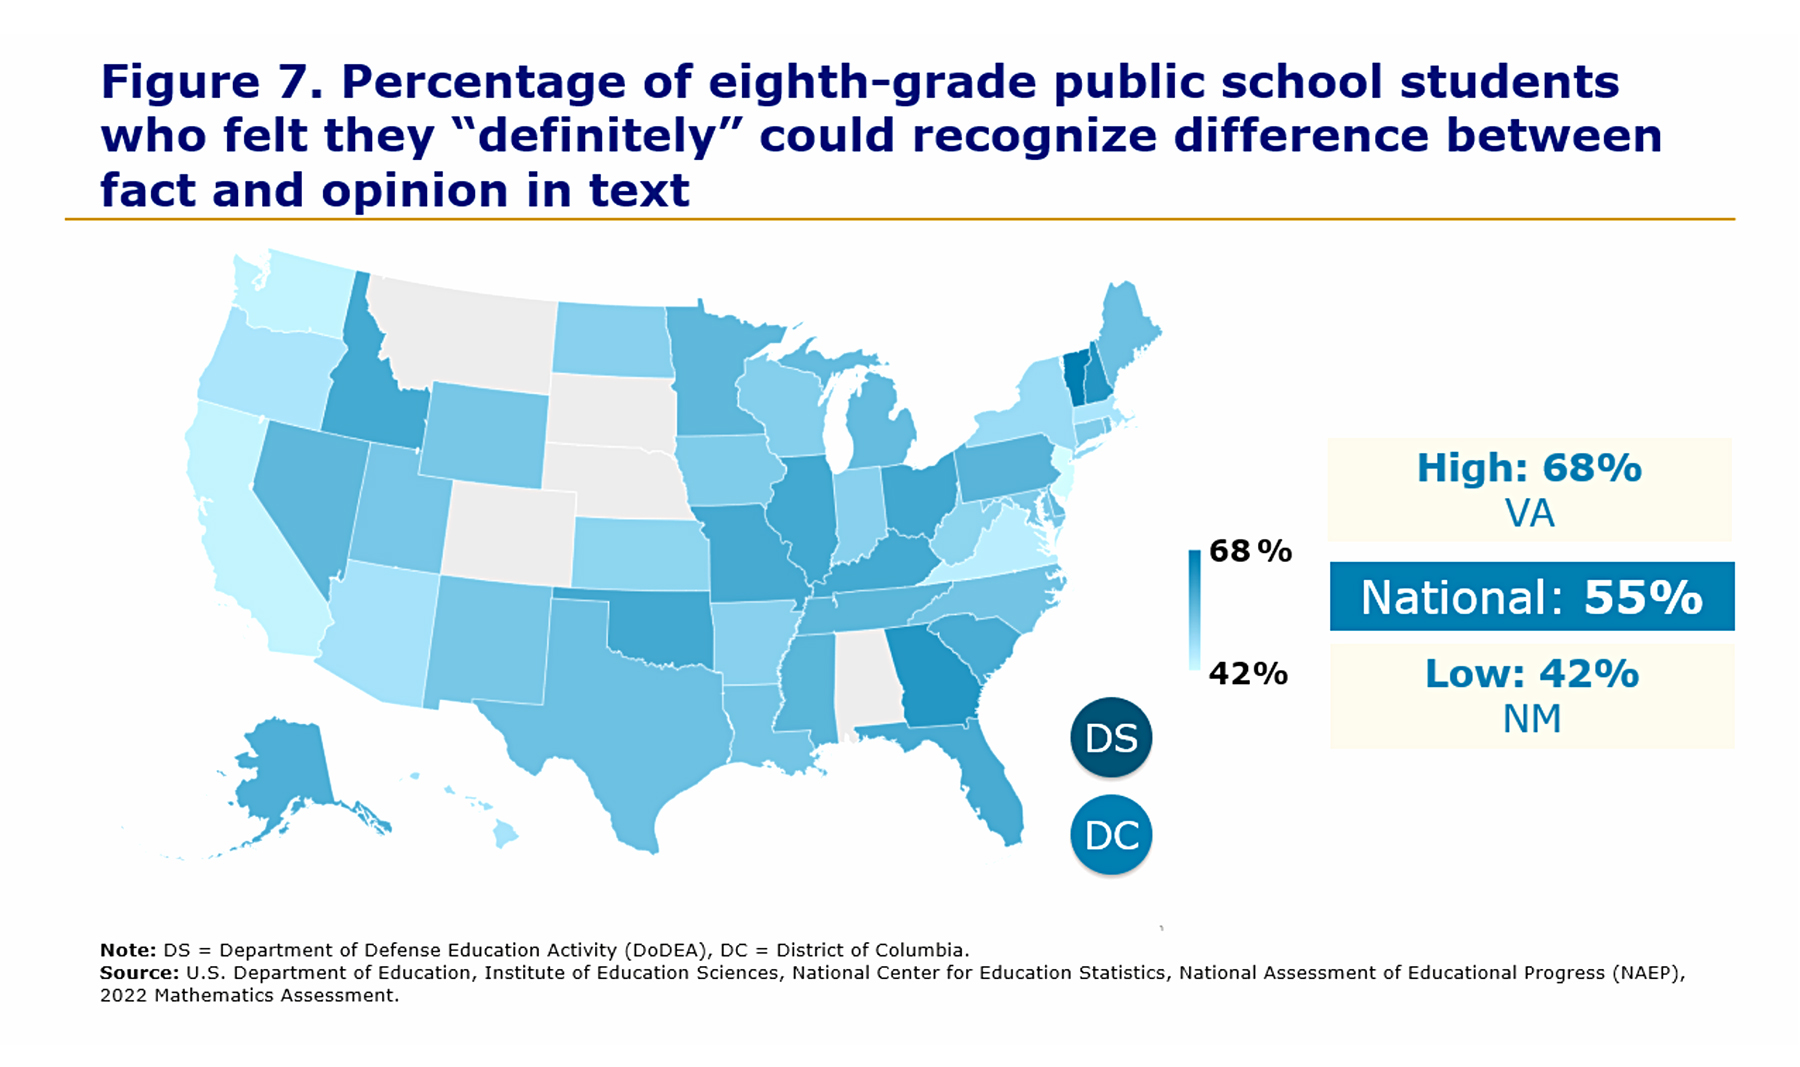
Turning to middle-schoolers’ confidence in their reading skills, eighth graders were asked if they could recognize the difference between fact and opinion in text. Fifty-five percent of the nation’s eighth-grade students reported in 2022 that they “definitely” could—a decrease from 60 percent in 2019. Across the country, the percentages ranged from 42 percent in New Mexico to 68 percent in Virginia (Fig. 7).
Teachers Respond
Teachers also shared insights into their levels of confidence and satisfaction in providing educational services to students during the pandemic. Most students had teachers who were confident in their ability to teach, but fewer students had teachers who were confident in addressing knowledge gaps and helping students with difficulties in distance learning during the 2021–2022 school year.
Among the nation’s fourth-grade public school students, 92 percent had teachers who felt they “probably” or “definitely” could conduct a distance learning lesson in real time, and 87 percent had teachers who felt they “probably” or “definitely” could create materials to engage students in distance learning. But only 46 percent had teachers who felt quite or extremely confident in their ability to address knowledge and skills gaps, from a low of 34 percent in Pennsylvania to a high of 68 percent in Puerto Rico.
NAEP survey results also showed growing proportions of students whose teachers reported being less satisfied with, and more frustrated in, their profession (Fig. 8). Asked if they agreed with the statement “I am satisfied with being a teacher at this school,” 72 percent of eighth-grade students had reading teachers who said the statement was “quite a bit” or “exactly” like them. This percentage, however, declined from 77 percent in 2019.
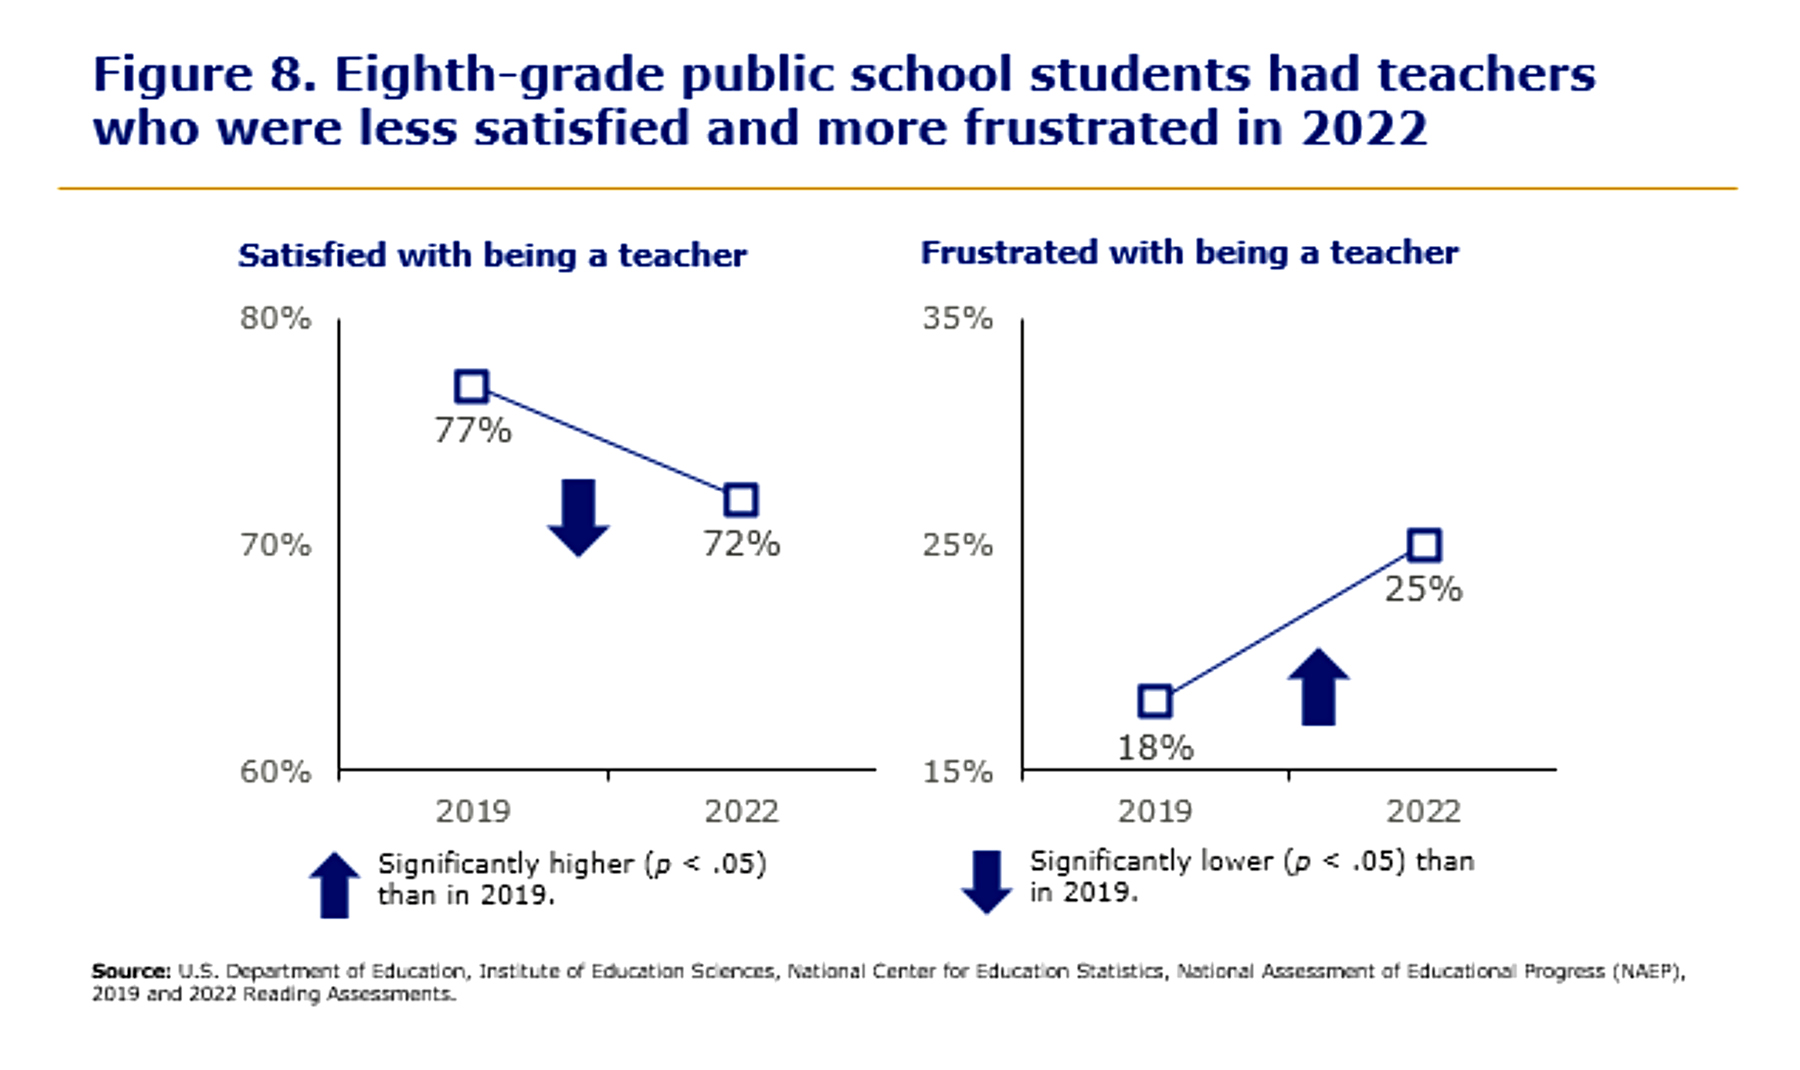
When teachers were asked if they agreed with the statement “I am frustrated as a teacher at my school,” one-quarter (25 percent) of the nation’s public school eighth graders had teachers who reported that this statement was “quite a bit” or “exactly” like them in 2022—an increase from 18 percent in 2019.
The relationship between these results and other factors in student achievement is complex. What contributes to outcomes like these varies from person to person, but the obvious goal for schools is to keep student confidence high and teacher frustration low. NAEP data offers a glance at student and teacher experiences and provides an indicator on trends in achievement.
The Way Forward
One takeaway from this information is that student and teacher perspectives can’t be ignored in the quest to advance student achievement; surveying their dispositions might offer an early indicator of future trends in achievement. The questions NAEP asked are a good place to start: How confident do fourth graders feel about dividing 42 stickers evenly among six students? How confident does an eighth grader feel in distinguishing fact from fiction? How confident do teachers feel using digital technologies in instruction? How frustrated are you and your staff in your roles? All of these questions are important to answer, study, and address.
“Research suggests a positive correlation between student achievement and confidence, highlighting that higher levels of confidence lead to increased engagement and ultimately yield improved outcomes,” Miller says. “Equally important is the quality of the teacher-student relationship, as supportive teachers possess the power to enhance students’ confidence and motivation, further impacting their academic performance and overall success.”
NAEP doesn’t provide an exhaustive list of the factors that contribute to achievement; it offers an approach to measuring and reporting mindsets and dispositions that might be overlooked or unconsidered. NCES will continue to share information on these factors, as they are important
indicators of the well-being of students, teachers, and public education systems nationwide.
The key to reversing trends such as these might lie in rebuilding the relationships that contribute to student confidence and foster a greater sense of belonging and community in schools. “Strengthening our social-emotional learning programming has proven effective in cultivating a sense of belonging, empathy, trust, and confidence among our students,” Miller says. “A personalized approach to learning has proven highly effective in bolstering student confidence and ensuring individual needs are met.”
While not a quick fix, a positive school culture is likely the more global prescription for building student confidence, educator satisfaction, and achievement. “Principals play a pivotal role in this process,” Miller says. “They must be communicative, collaborative, celebratory, and consistent. By promoting continuous improvement and inspiring the team, principals can cultivate a positive school culture over time, recognizing that a collective effort is crucial for success.”
Ebony Walton and James Deaton are statisticians at the National Center for Education Statistics.